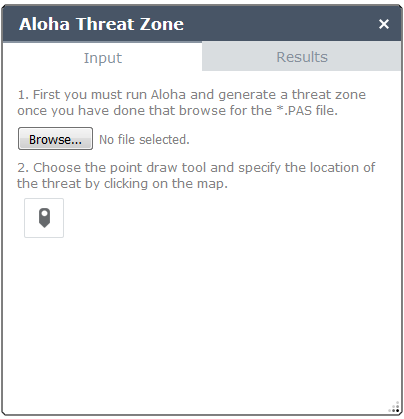
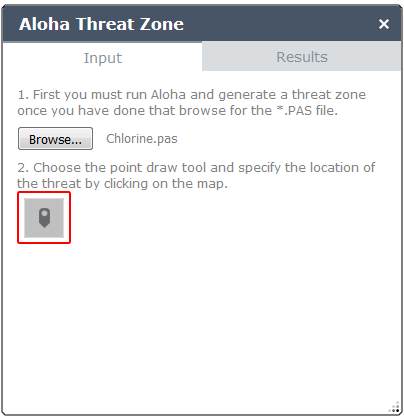
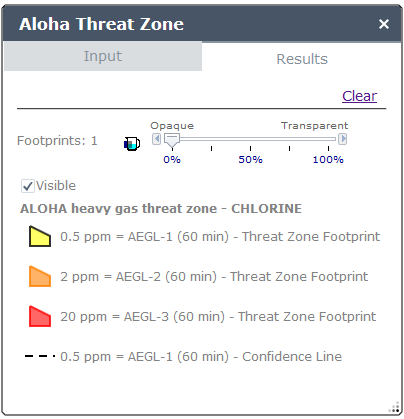
- Hover the mouse over the Aloha Threat Zone widget and click the small edit icon
 .
.
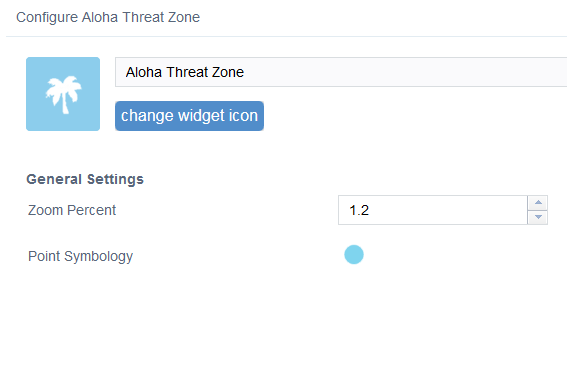
This opens the configuration window for this widget.

- Optionally, click change widget icon if you want to replace the default icon for this widget.
A file explorer window opens allowing you to browse to a local image file to use as the widget icon.
- Optionally you can change the zoom percentage that the widget will zoom to when the Aloha Threat Zone is added to the map.
- Optionally you can change the marker symbol used for locating the point of origin in the map.


